GeneQuery is an expression-based phenotype searching engine based on human, mouse, and rat microarray experiments. Unlike other tools, like DAVID or MsigDB, GeneQuery does not use manually curated gene sets associated with a particular pathway or perturbation. Instead, we use WGCNA clustering to obtain a vast database of co-expression clusters from available GEO microarray experiments. The data used span X human, Y mouse, and Z rat data series that included 8-200 samples, thus covering a substantial fraction of all published microarray expression profiling experiments. We believe that this approach is much better suited to address biological complexity and variation, and can help generate valuable biological hypotheses.
To start using GeneQuery, all you need is a list of genes that you have found to be significant in your experiment. It can be a list of differentially expressed genes (we suggest using up- and down-regulated signatures separately), or candidate regulated genes from a DNase-Seq or a ChIP-Seq experiment. GeneQuery accepts the following types of gene IDs: Entrez, universal gene symbol (HGNC/MGNC), RefSeq, and Ensembl. It is also natively supports a search using orthologous genes based on NCBI Homologene – which means you can search a list of human genes against the mouse database or rat, and still get meaningful results (in fact, we strongly encourage you to try it).
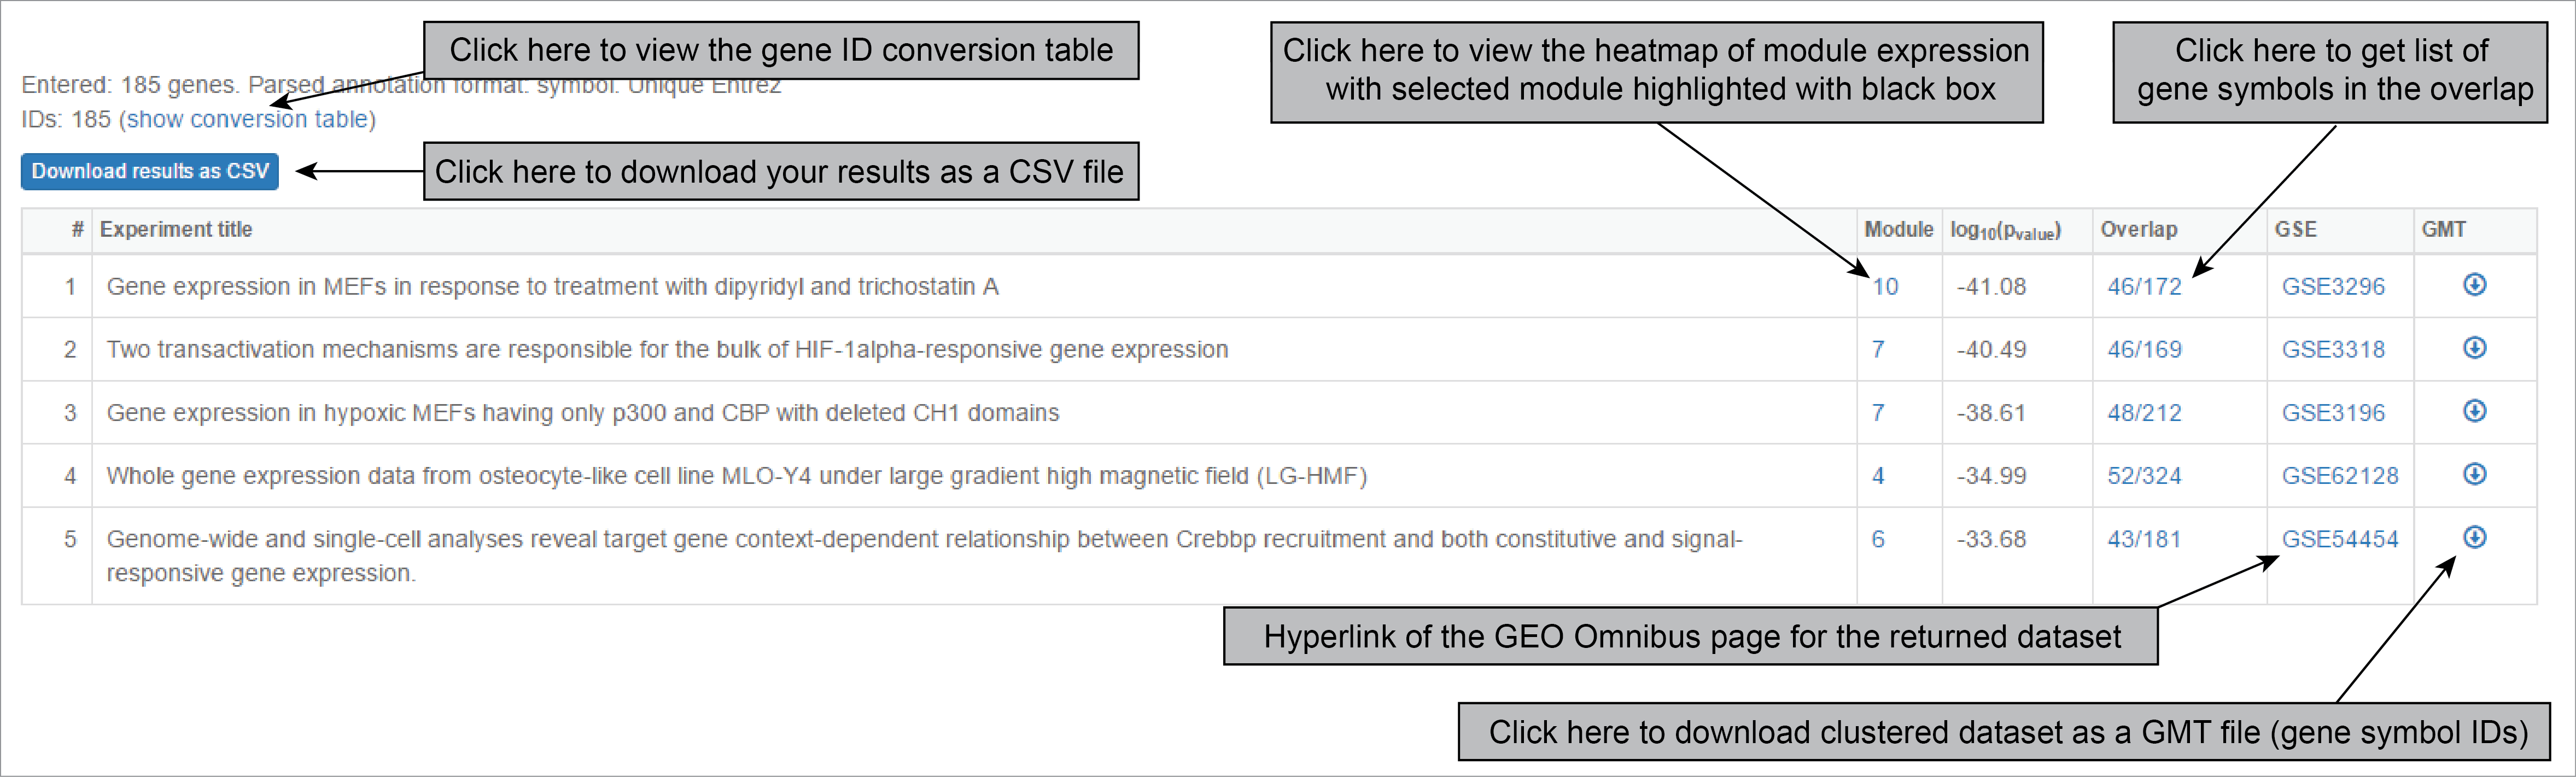
When output is obtained, results are ranked according to adjusted p-value, calculated as Fisher’s p-value with Bonferroni correction. Each result corresponds to a matching module, which number is specified. The output also contains name, abstract, and links to GEO dataset that was matched. To see if module actually represents certain meaningful group of co-expressed genes, click on “heatmap” and find the module number that was matched.
The most important part of the output is the module expression heatmap. If you see that the expression of the module of interest corresponds the groups according to sample names. However, if you see that the expression does not change according to sample names (for example, the module is up-regulated in one sample only), you might be dealing with an outlier or a case of failed clustering. In the example below, this is one of the results returned by hypoxia gene signature. This is an informative hit, capturing the transcriptional signature of hypoxic response.
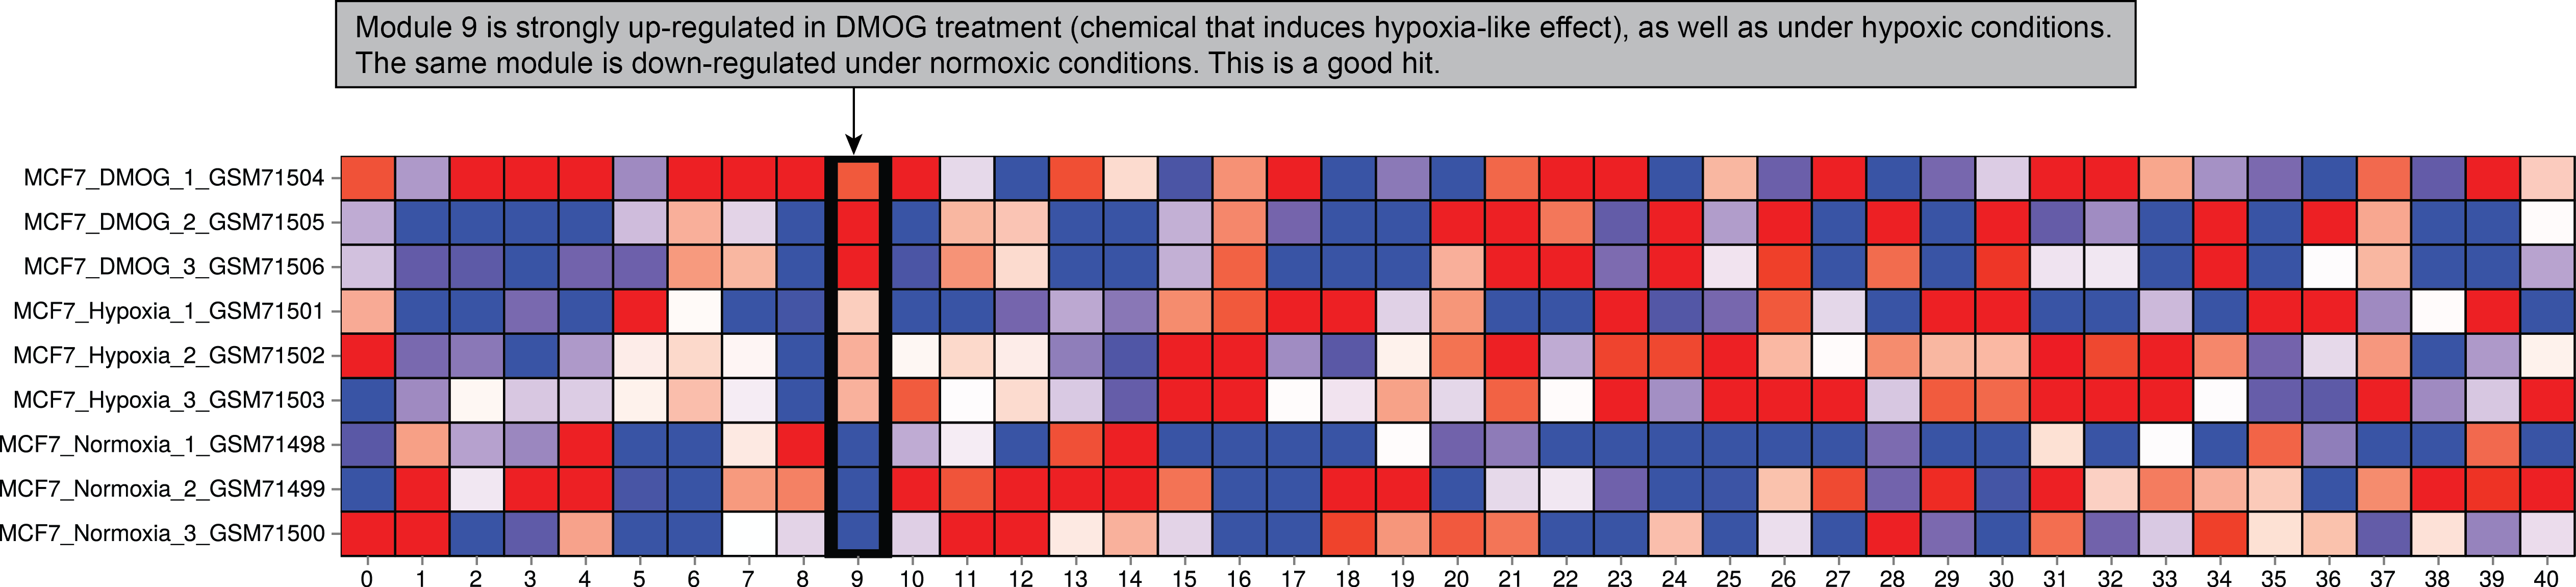
You also can see the the example.
In the downloads section you can obtain all of the databases used by GeneQuery, as well as pre-computed results for all of the MsigDB hallmark genesets queried against our human, mouse, and rat databases.
If you have more technical questions or a bug report, please do not hesitate contacting us.