This page contains our data and publicly available datasets on immune system aging in human and model organisms
(mice and rats), emphasizing single-cell recourses. We processed scRNA-seq and scATAC-seq datasets to make them
available for visualization, exploration, and analysis in the Browser.
Our datasets
Comprehensive profiling of aging immune system in mice and humans (Mogilenko et al., Immunity 2021
[10.1016/j.immuni.2020.11.005])
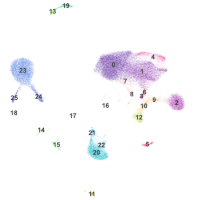
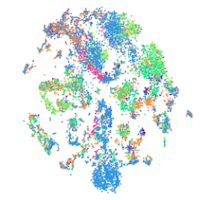
- scRNA-seq of CD45+ cells from the spleen, peritoneum, lungs, and liver from young and aged male mice
- Bulk RNA-seq of splenic naïve (TN), effector memory (TEM), and age-associated (TAA) CD8+ T cells from aged
mice
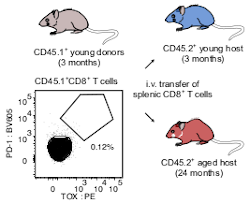
- scRNA-seq of splenic CD8+ T cells from young mouse donor (ALAW-4) 1-month post-transfer into the aged host
and splenic CD8+ T cells from the host (ALAW-3)
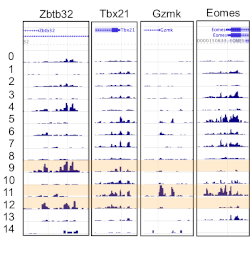
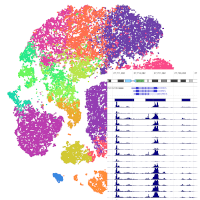
- scATAC-seq of CD45+ cells from the spleen from young and aged male mice
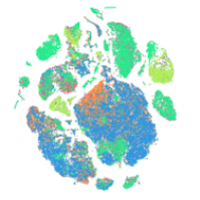
- scRNA-seq of PBMCs from 11 young and ten old healthy male donors
- scATAC-seq of PBMCs from 3 young and three old healthy male donors
Public datasets
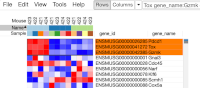
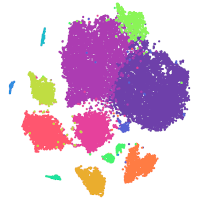
- scRNA-seq of immune cells selected from the Tabula Muris Senis dataset
(The Tabula Muris Consortium, Nature 2020 [10.1038/s41586-020-2496-1])
- scRNA-seq of kidney, lung, and spleen from young (7-8 months) and old (22-23 months) male mice
(GSE132901)
(Kimmel et al., Genome Reseach 2019 [
doi:10.1101/gr.253880.119)
- scRNA-seq of tissue regulatory T cell precursors in lymphoid organs (GSE130879)
(Delacher et al. Immunity 2020 [10.1016/j.immuni.2019.12.002])
- scRNA-seq of LCMV antigen-specific CD8+ T cells from early phase of acute and chronic infection
(Chen et al., Immunity 2019 [10.1016/j.immuni.2019.09.013])
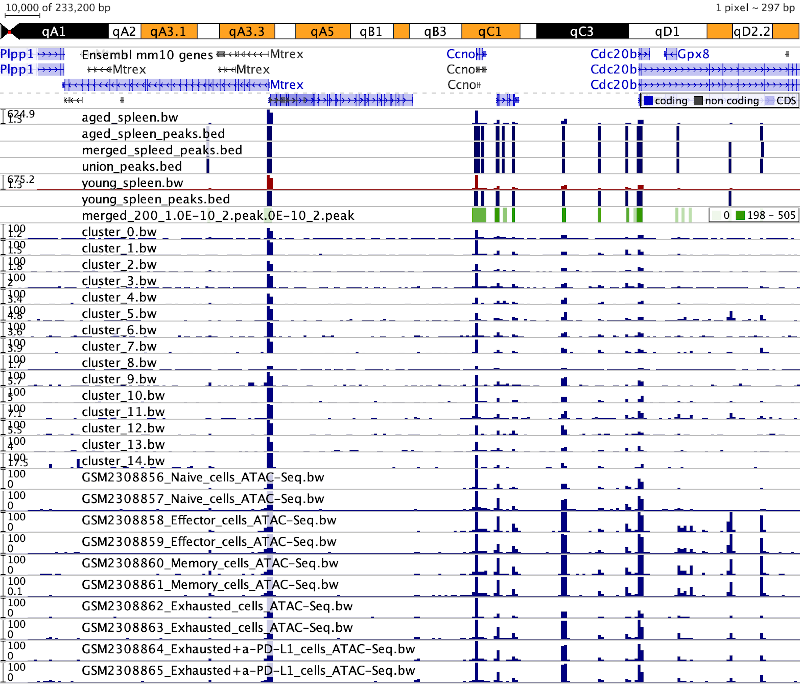
- ATAC-seq: epigenetic stability of exhausted T cells limits durability of reinvigoration by PD-1 blockade
(GSE867989)
(Pauken, Kristen et al., Science 2016 [10.1126/science.aaf2807])
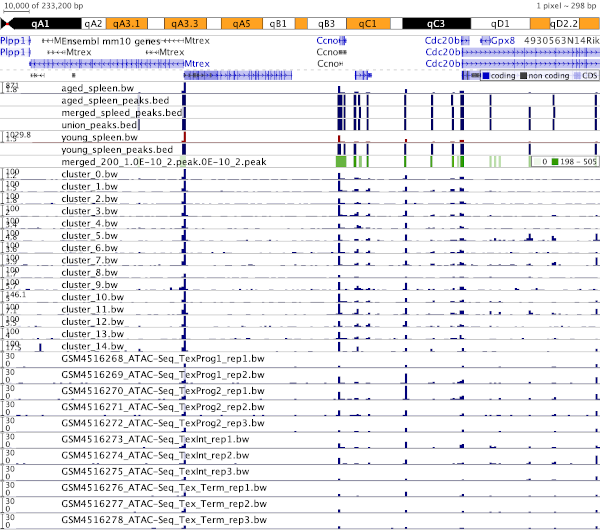
- scRNA-seq: Developmental relationships of four exhausted CD8+ T cell subsets reveals underlying
transcriptional and epigenetic landscape control mechanisms (GSE149879)
(Beltra, Jean-Christophe, et al., Immunity 2020 [10.1016/j.immuni.2020.04.014])
-
scRNA-seq reveals expansion of cytotoxic CD4+ T cells in supercentenarians
(Hashimoto et al, PNAS, 2019 [10.1073/pnas.1907883116])
-
scRNA-seq atlas of the aging lung in mice
(Angelidis et al, Nat Comms, 2019 [10.1038/s41467-019-08831-9])
-
scRNA-seq: Heterogeneity of meningeal B cells reveals a lymphopoietic niche at the CNS borders
(Brioschi*, Wang*, Peng* et al, Science, 2021 [10.1126/science.abf9277])
-
scRNA-seq of the human skin reveals age-related loss of fibroblast priming
(Sole-Boldo et al, Commun Biol. 2020 [10.1038/s42003-020-0922-4])
-
scRNA-seq: Aging promotes reorganization of the CD4+ T cell landscape toward extreme regulatory and effector
phenotypes
(Elyahu*, Hekselman* et al, Sci Adv, 2019 [10.1126/sciadv.aaw8330])
-
scRNA-seq: Caloric restriction reprograms the single-cell transcriptional landscape of rat (Rattus
Norvegicus)
aging
(Ma et al, Cell 2020 [10.1016/j.cell.2020.02.008])
-
Molecular hallmarks of heterochronic parabiosis at single-cell resolution
(Pálovics R. et al, Nature 2022 [10.1038/s41586-022-04461-2])
Our datasets
scRNA-seq of CD45+ cells from the spleen, peritoneum, lungs and the
liver from young and aged male mice
Bulk RNA-seq of splenic naïve (TN), effector memory (TEM) and age-associated (TAA) CD8+ T cells from aged
mice
scRNA-seq of splenic CD8+ T cells from the young donor (ALAW-4)
1-month post-transfer into the aged host and splenic CD8+ T cells from the host (ALAW-3)
scATAC-seq of CD45+ cells from the spleen from young and aged male mice
scRNA-seq of PBMCs from 11 young and ten old healthy male donors
scATAC-seq of PBMC from 3 young and 3 old healthy male donors
Processed data from public datasets
scRNA-seq of immune cells selected from the Tabula Muris Senis
scRNA-seq of kidney, lung, and spleen from young (7-8 months)
and old (22-23 months) male mice (GSE132901)
scRNA-seq of tissue regulatory T cell precursors in
lymphoid organs (GSE130879)
scRNA-seq of LCMV antigen-specific CD8+ T cells from the early phase
of acute and chronic infection
ATAC-seq: epigenetic stability of exhausted T cells limits durability
of reinvigoration by PD-1 blockade (GSE867989)
Developmental Relationships of Four Exhausted CD8+ T Cell Subsets
Reveals Underlying Transcriptional and Epigenetic Landscape Control Mechanisms (GSE149879)
scRNA-seq reveals expansion of cytotoxic CD4+ T cells in
supercentenarians
scRNA-seq atlas of the aging lung in mice
scRNA-seq: Heterogeneity of meningeal B cells reveals a lymphopoietic
niche at the CNS borders
scRNA-seq of the human skin reveals age-related loss of fibroblast
priming (GSE130973)
scRNA-seq: Aging promotes reorganization of the CD4+ T cell landscape
toward extreme regulatory and effector phenotypes
scRNA-seq: Caloric restriction reprograms the single-cell
transcriptional landscape of rat (Rattus Norvegicus) aging
scRNA-seq from the Tabula Muris Senis and
heterochronic parabiosis (young and old mice)